


Turn your data into insight. Let's start with a 40-hour Tableau proof-of-concept for $2,500. Send your brief →
This engagement focused on the end-to-end design and deployment of a multi-source performance intelligence dashboard built in Google Looker Studio to monitor installer KPIs, operational service metrics, and revenue performance across a three-month reporting horizon. The mandate extended beyond visualization; it required full-stack analytics architecture, including data pipeline integration, query development, theming alignment, and narrative-driven executive reporting across 3–5 structured dashboard views.
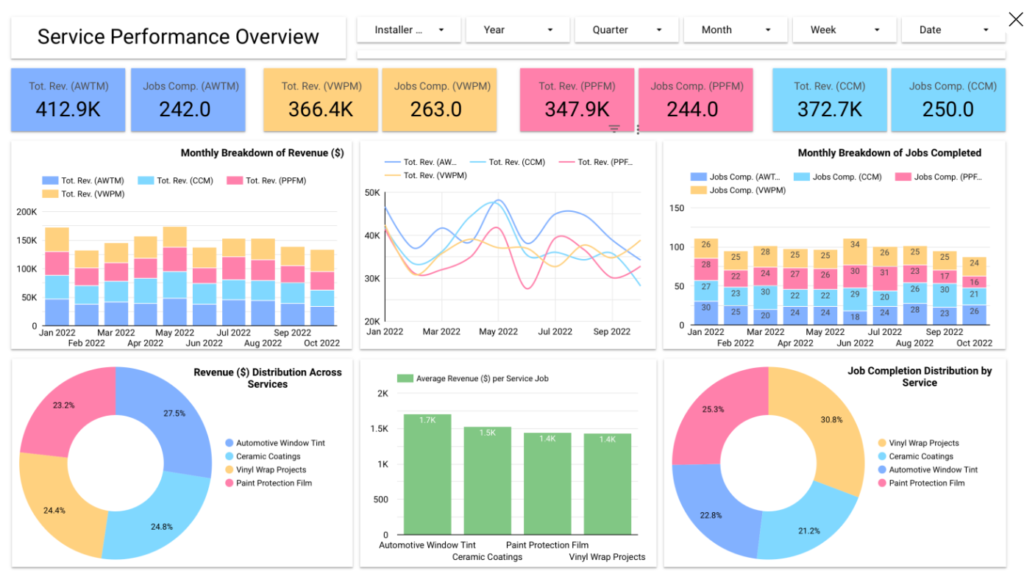
The solution integrated approximately ten live datasets sourced from Microsoft SQL-based databases. Custom SQL queries were authored to structure, aggregate, and optimize performance metrics before ingestion into Looker Studio. The dashboard framework tracked jobs completed, revenue trends, service-specific breakdowns, installer productivity, and client satisfaction scores. To further enhance operational data capture, a Google Form and Google Sheet ingestion layer was engineered to enable structured, real-time input of performance and service metrics. This automated data collection mechanism reduced reporting latency and ensured immediate synchronization with the visualization layer.
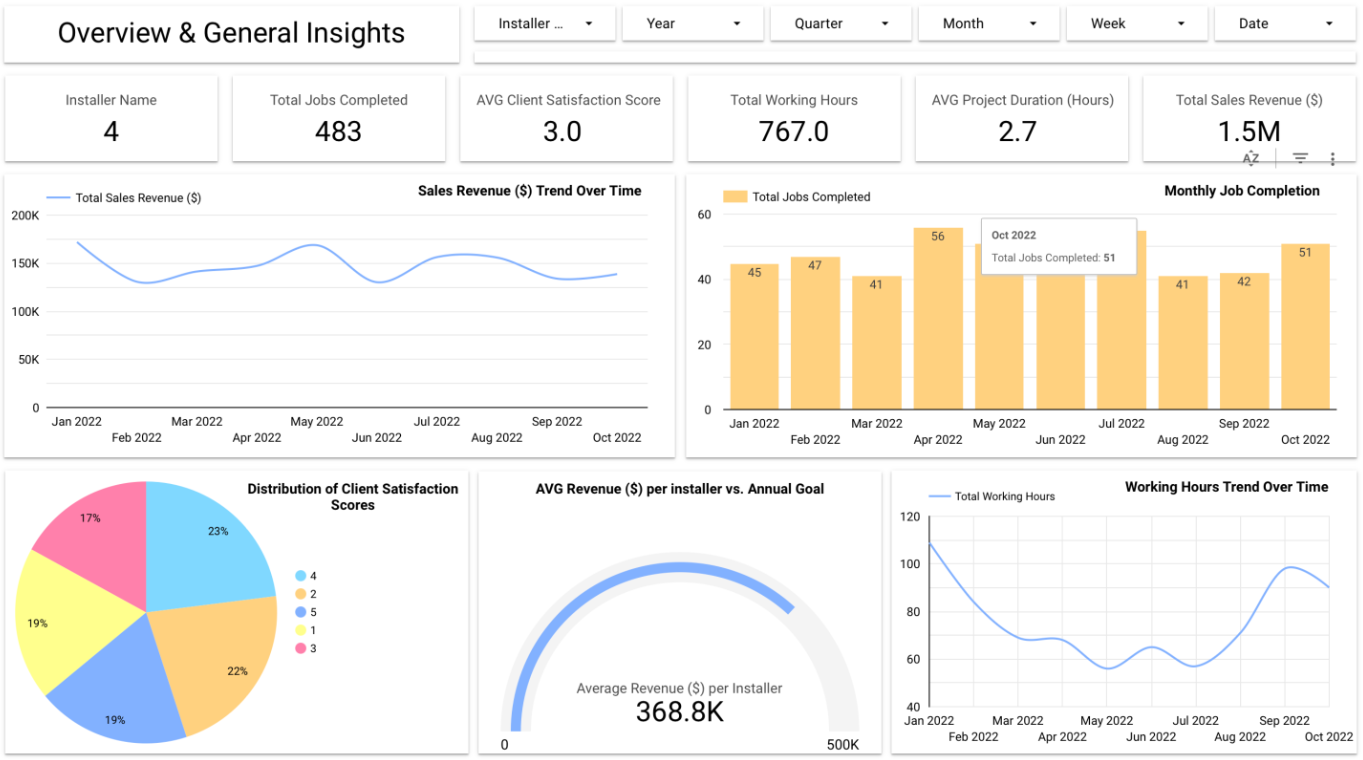
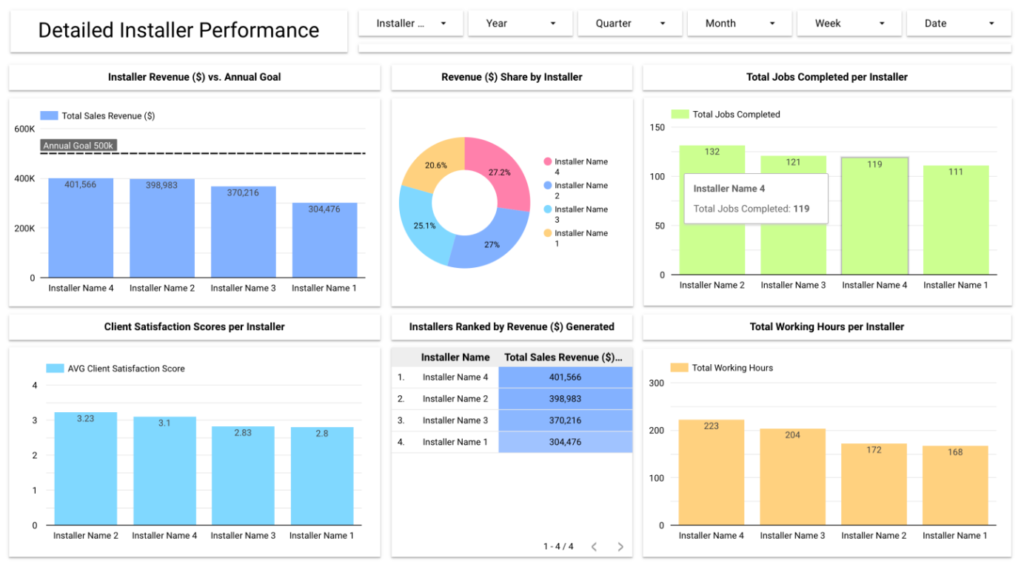
From a design and analytics standpoint, the dashboard was developed as a story-driven decision-support system. KPIs were logically grouped to reflect operational hierarchies—installer-level metrics feeding into service-level analytics, which then rolled up into revenue and performance summaries. Visual hierarchy, corporate theming, and clean UI standards were applied to ensure brand consistency and executive readability. Widgets, charts, and time-series analyses were structured to allow stakeholders to identify productivity gaps, service efficiency trends, revenue drivers, and customer satisfaction patterns within a single analytical environment.
This project demonstrates advanced capabilities in data modeling, SQL query engineering, cross-platform integration (Microsoft SQL to Google ecosystem), automation via Google Forms and Sheets, and enterprise-grade dashboard storytelling. The final deliverable provided leadership with a scalable, low-maintenance analytics framework capable of evolving alongside operational growth.
The engagement concluded with multiple 5.0/5 client ratings, reflecting professionalism, collaboration, and commitment to quality. It stands as a representative case study in transforming distributed operational data into a cohesive performance intelligence platform—bridging backend engineering, automated data capture, and executive-level visualization within a unified BI architecture.


